Mice and rats
Here is a curious case in which one data curve appears in two papers (one on rats, the other on mice). This would seem to be a remarkable coincidence.
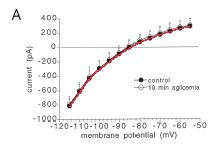
Consider this 1997 study performed in rats: "Endogenous Adenosine Mediates the Presynaptic Inhibition Induced by Aglycemia at Corticostriatal Synapses", Journal of Neuroscience, 17: 4509 - 4516.

Here is Figure 1A of this study. The colored curve was added by hand to overlap with the black data points.

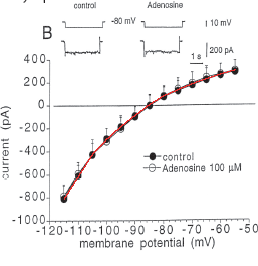
The same curve reappears in Figure 3B. Indeed, the colored curve is the same as in the previous figure (scaled rigidly). It passes through all the black data points. This similarity would be easily explained if the control data were the same for the two figures.
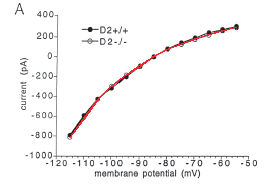
Now consider another 1997 study by the same group, this one performed in mice: "Abnormal Synaptic Plasticity in the Striatum of Mice Lacking Dopamine D2 Receptors", Journal of Neuroscience, 1997; 17: 4536 - 4544.

Here is Figure 1A of this second study. The red curve was added to the figure: it is the same as the one in the two figures of the previous paper (again, scaled rigidly). The curve overlaps the white data points , which are the ones for the genetically modified mice.
It seems to be a remarkable coincidence that the genetic modification made mice yield the same curve as wild-type rats.

0 Comments:
Post a Comment
<< Home